

Time UTC


Current images of our sun
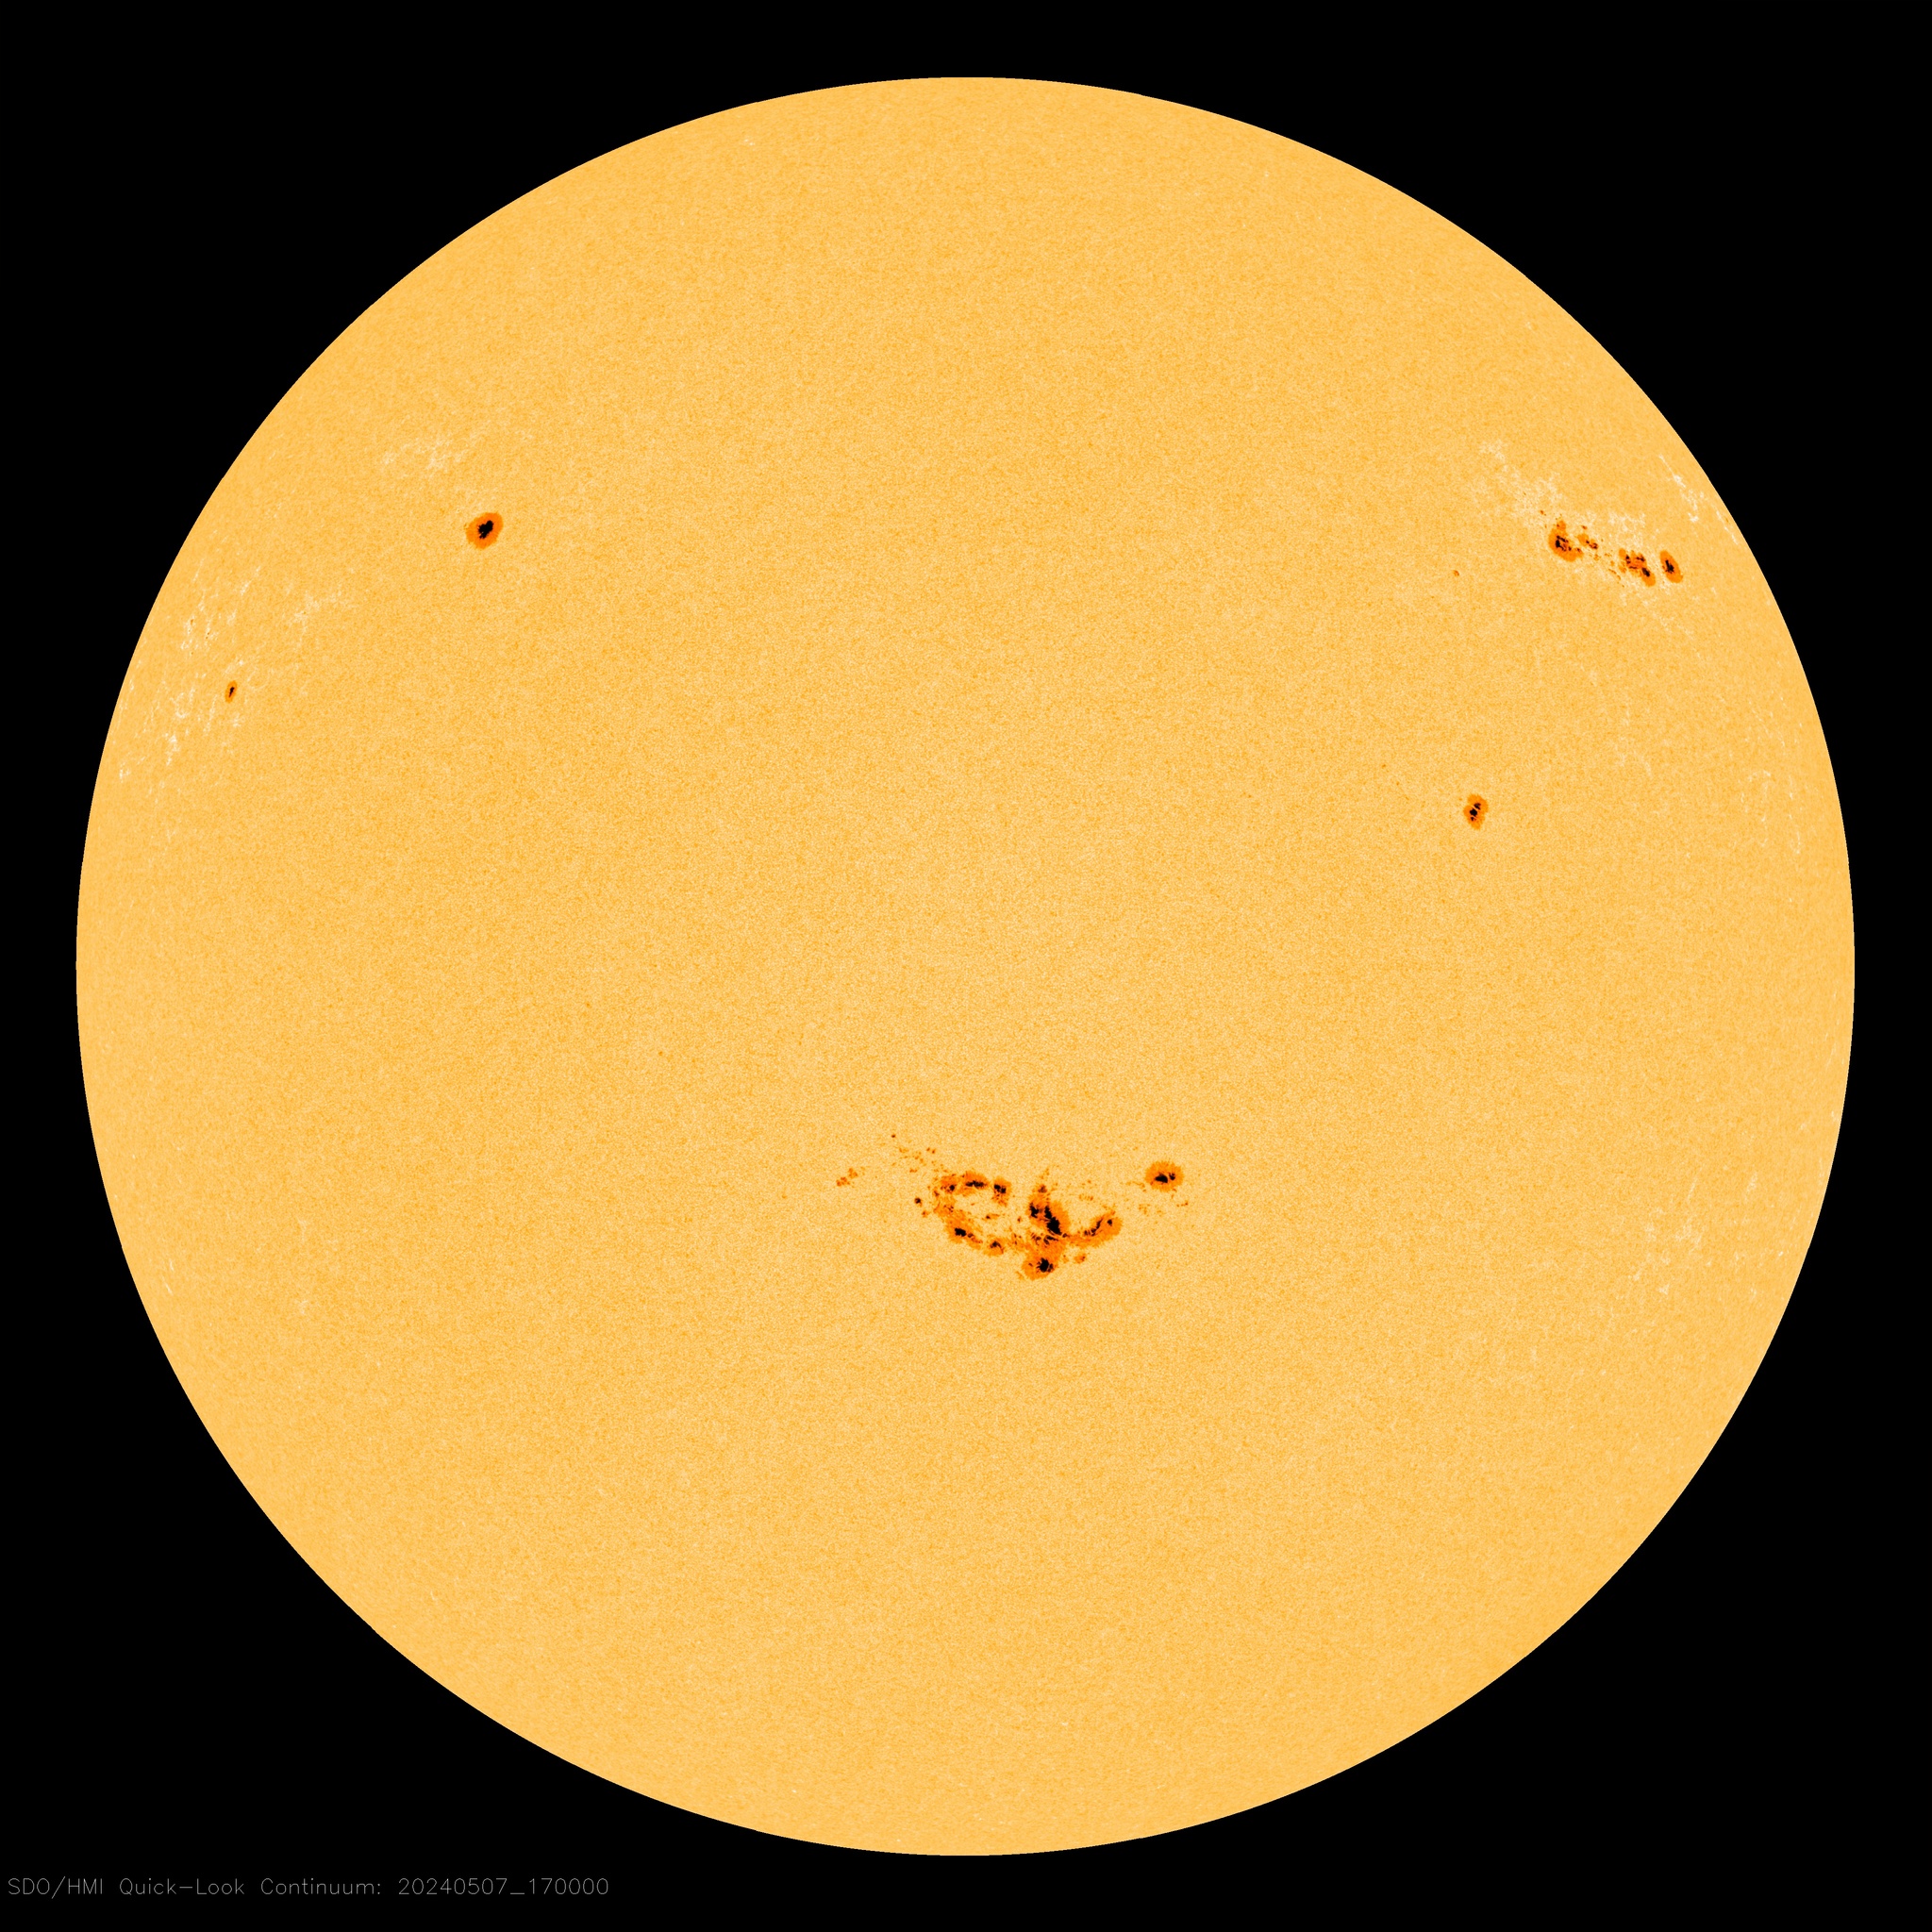
HMI Intensity

HMI Magnetogram
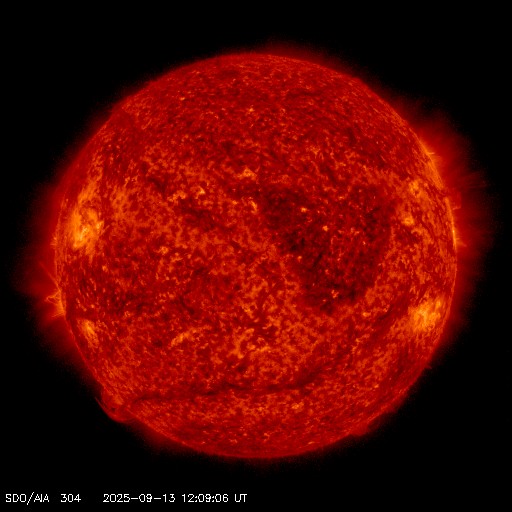
304 Angstroms
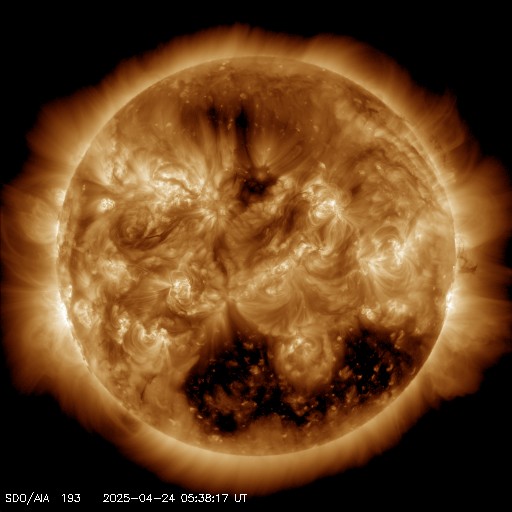
193 Angstroms – Coronal Holes
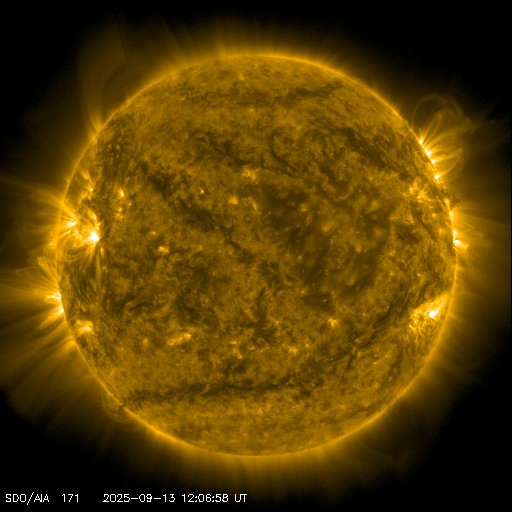
171 Angstroms
Space weather impacts radio communication in a number of ways. At frequencies in the 1 to 30 MHz range (HF radio), the changes in ionospheric density and structure modify the transmission path and even block transmission of HF radio signals completely.
In the red image (304 Angstroms), we can see very small spicules—jets of solar material—and some small prominences at the sun’s edge, which are not easy to see in the other two images. In the second sequence (193 Angstroms), we can readily observe the large and dark coronal hole, though it is difficult to make out in the others. In the third image (171 Angstroms), we can see strands of plasma waving above the surface.
Space Weather describes the variations in the space environment between the sun and Earth.
In particular, Space Weather describes the phenomena that impact systems and technologies in orbit and on Earth.
D REGION ABSORPTION PREDICTIONS (D-RAP)
There are several types of space weather that can impact HF radio communication. In a typical sequence of space weather storms, the first impacts are felt during the solar flare itself. The solar x-rays from the sun penetrate to the bottom of the ionosphere (to around 80 km). There the x-ray photons ionize the atmosphere and create an enhancement of the D layer of the ionosphere.
This enhanced D-layer acts both as a reflector of radio waves at some frequencies and an absorber of waves at other frequencies. The Radio Blackout associated with solar flares occurs on the dayside region of Earth and is most intense when the sun is directly overhead.
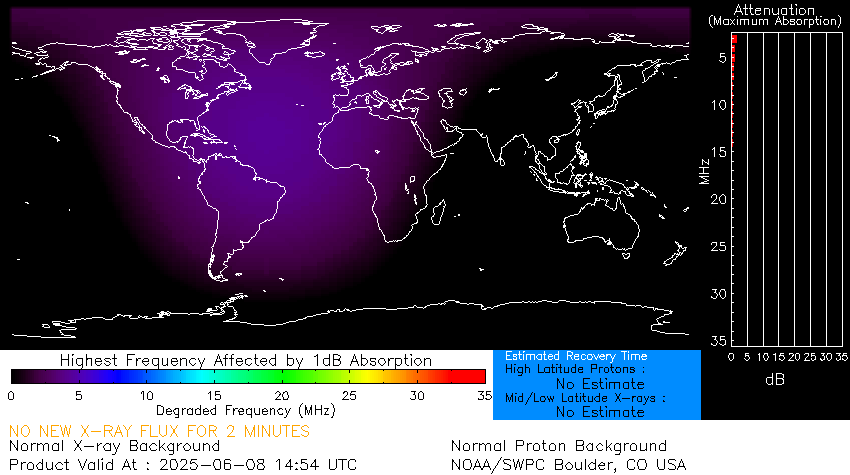
CURRENT D REGION ABSORPTION PREDICTION
CURRENT SPACE WEATHER OBSERVATIONS
SOLAR X-RAY FLUX
The GOES X-ray plots shown here are used to track solar activity and solar flares. Large solar X-ray flares can change the Earth’s ionosphere, which blocks high-frequency (HF) radio transmissions on the sunlit side of the Earth. Solar flares are also associated with Coronal Mass Ejections (CMEs) which can ultimately lead to geomagnetic storms.
While increasing SFI may be good for HF propagation, it also tends to correspond with high Ap and K indices, which cause D-Layer absorption and noisy band condition.
SOLAR PROTON FLUX
Protons are charged particles and are therefore influenced by magnetic fields
GEO MAGNETIC ACTIVITY
In a simplified view, geomagnetic activities are the product of the interaction between the solar wind and magnetosphere. The Kp Index (p = planetary) is the measure.
The K-index, and by extension the Planetary K-index, are used to characterize the magnitude of geomagnetic storms. Kp is an excellent indicator of disturbances in the Earth’s magnetic field and is used by SWPC to decide whether geomagnetic alerts and warnings need to be issued for users who are affected by these disturbances.
The principal users affected by geomagnetic storms are the electrical power grid, spacecraft operations, users of radio signals that reflect off of or pass through the ionosphere, and observers of the aurora.
24 HOUR SOLAR ACTIVITY SUMMARY
LATEST VIDEO
This channel highlights the outer atmosphere of the Sun – called the corona – as well as hot flare plasma. Hot active regions, solar flares, and coronal mass ejections will appear bright here. The dark areas – called coronal holes – are places where very little radiation is emitted, yet are the main source of solar wind particles.
THE SUN (EUV)
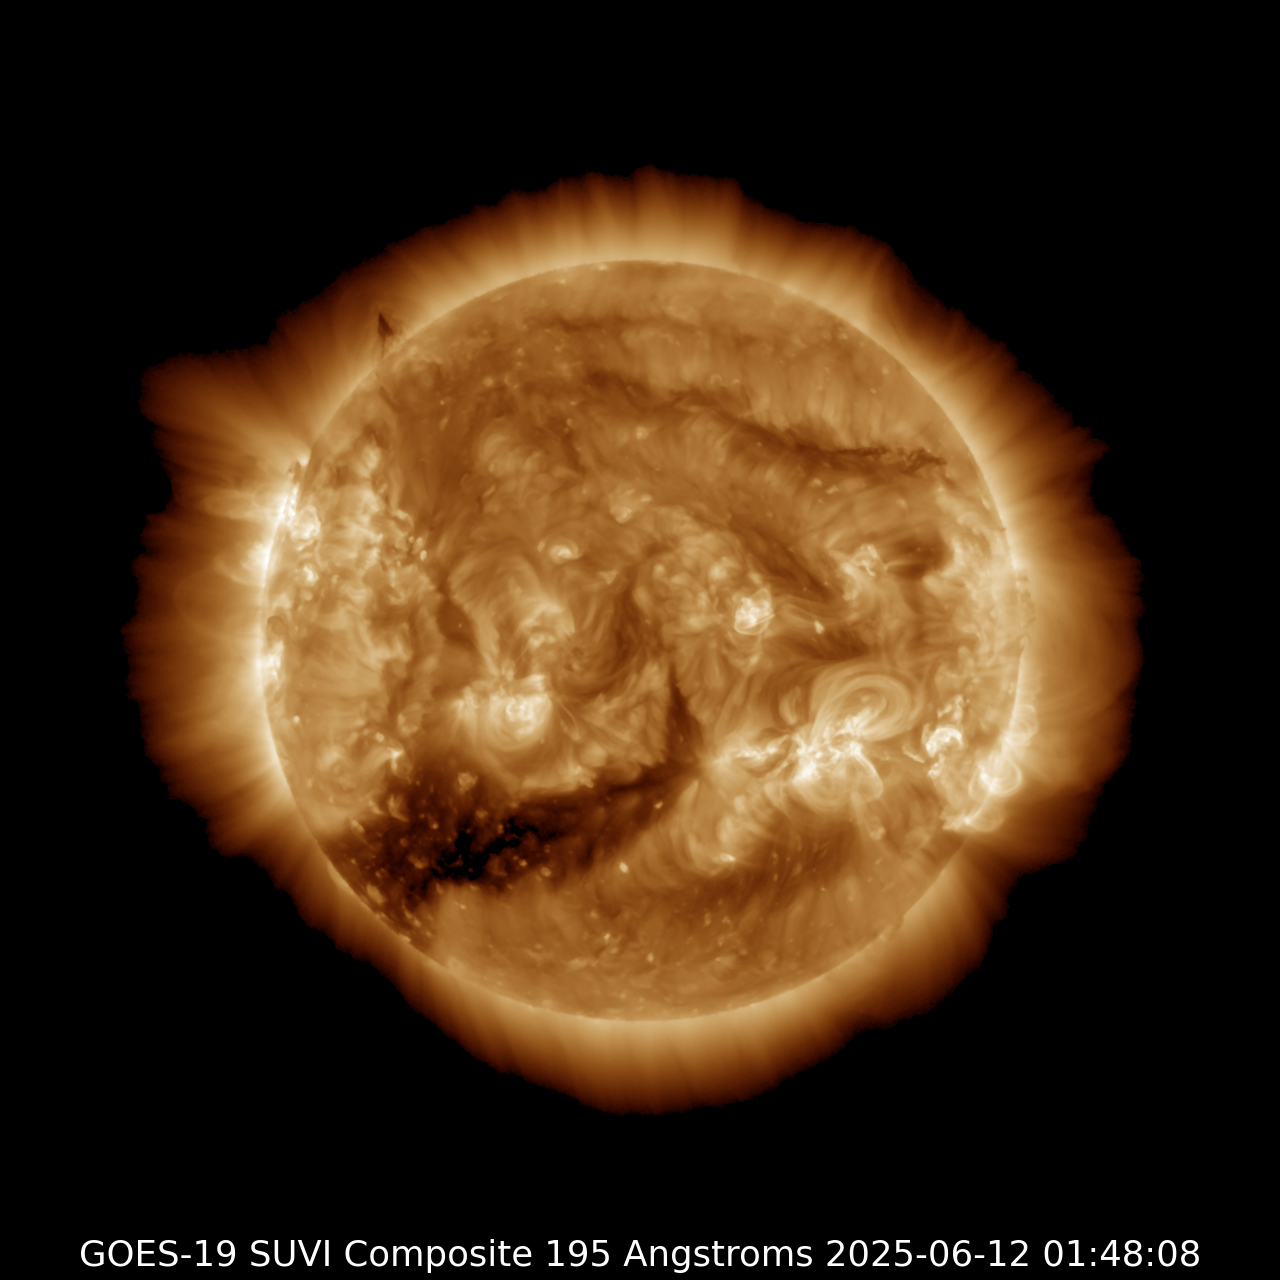
The GOES 16 and 17 spacecraft each carry a sophisticated extreme ultraviolet (EUV) telescope called the Solar Ultraviolet Imager (SUVI). This telescope allows forecasters to monitor the Sun’s hot outer atmosphere or corona. EUV photons are created in the million-degree plasma of the corona and are not visible from the ground, due to the absorption of the Earth’s atmosphere. Observations of solar EUV emission aids in the early detection of solar flares, coronal mass ejections (CMEs), and other phenomena that impact the geospace environment.
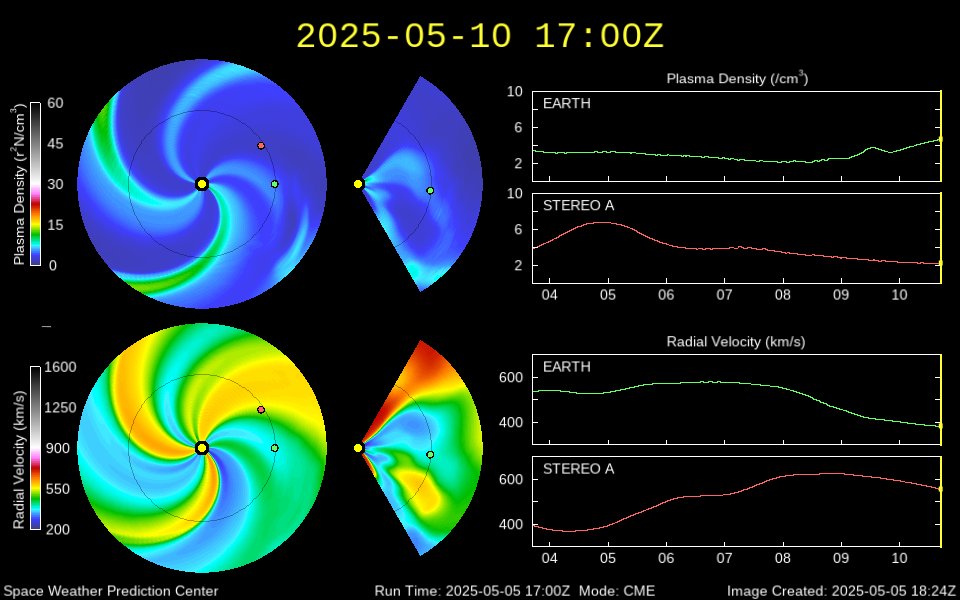
CORONAL MASS EJECTIONS
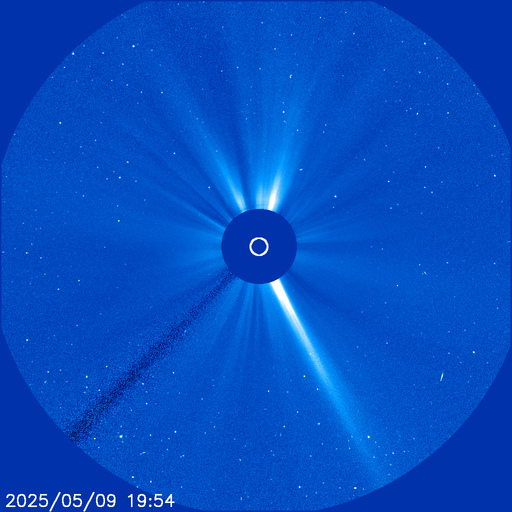
Coronal Mass Ejections (CMEs) are large expulsions of plasma and magnetic field from the Sun’s corona. They can eject billions of tons of coronal material and carry an embedded magnetic field (frozen in flux) that is stronger than the background solar wind interplanetary magnetic field (IMF) strength. CMEs travel outward from the Sun at speeds ranging from slower than 250 kilometres per second (km/s) to as fast as near 3000 km/s. The fastest Earth-directed CMEs can reach our planet in as little as 15-18 hours.
THE AURORA
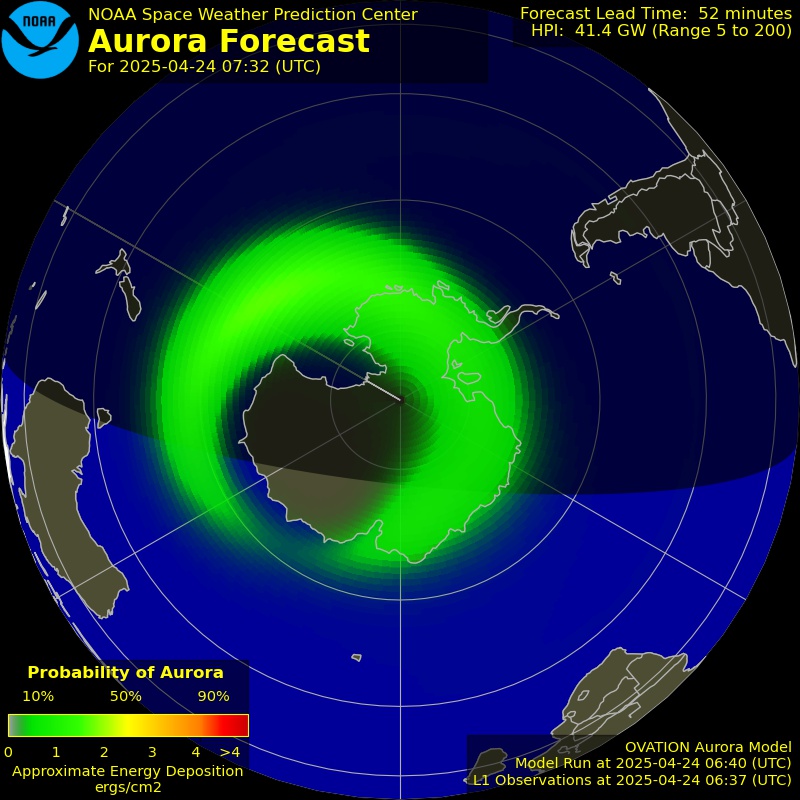
This is a short-term forecast of the location and intensity of the aurora. This product is based on the OVATION model and provides a 30 to 90 minute forecast of the location and intensity of the aurora.
The aurora is an indicator of the current geomagnetic storm conditions and provides situational awareness for a number of technologies. The aurora directly impacts HF radio communication and GPS/GNSS satellite navigation. It is closely related to the ground induce currents that impact electric power transition.
Space weather can occur anywhere from the surface of the sun to the surface of Earth.
As a space weather storm leaves the sun, it passes through the corona and into the solar wind. When it reaches Earth, it energizes Earth’s magnetosphere and accelerates electrons and protons down to Earth’s magnetic field lines where they collide with the atmosphere and ionosphere, particularly at high latitudes.
Each component of space weather impacts a different technology.
Source: NOAA
SOLAR WIND
The Sun releases a constant stream of particles and magnetic fields called the solar wind. This solar wind slams worlds across the solar system with particles and radiation – which can stream all the way to planetary surfaces unless thwarted by an atmosphere, magnetic field, or both. Here’s how these solar particles interact with a few select planets and other celestial bodies. The solar wind is mostly deflected by our magnetic field, but sometimes, when intense, some of it can leak through. Once in near-Earth space, the particles can trigger aurora near the poles.

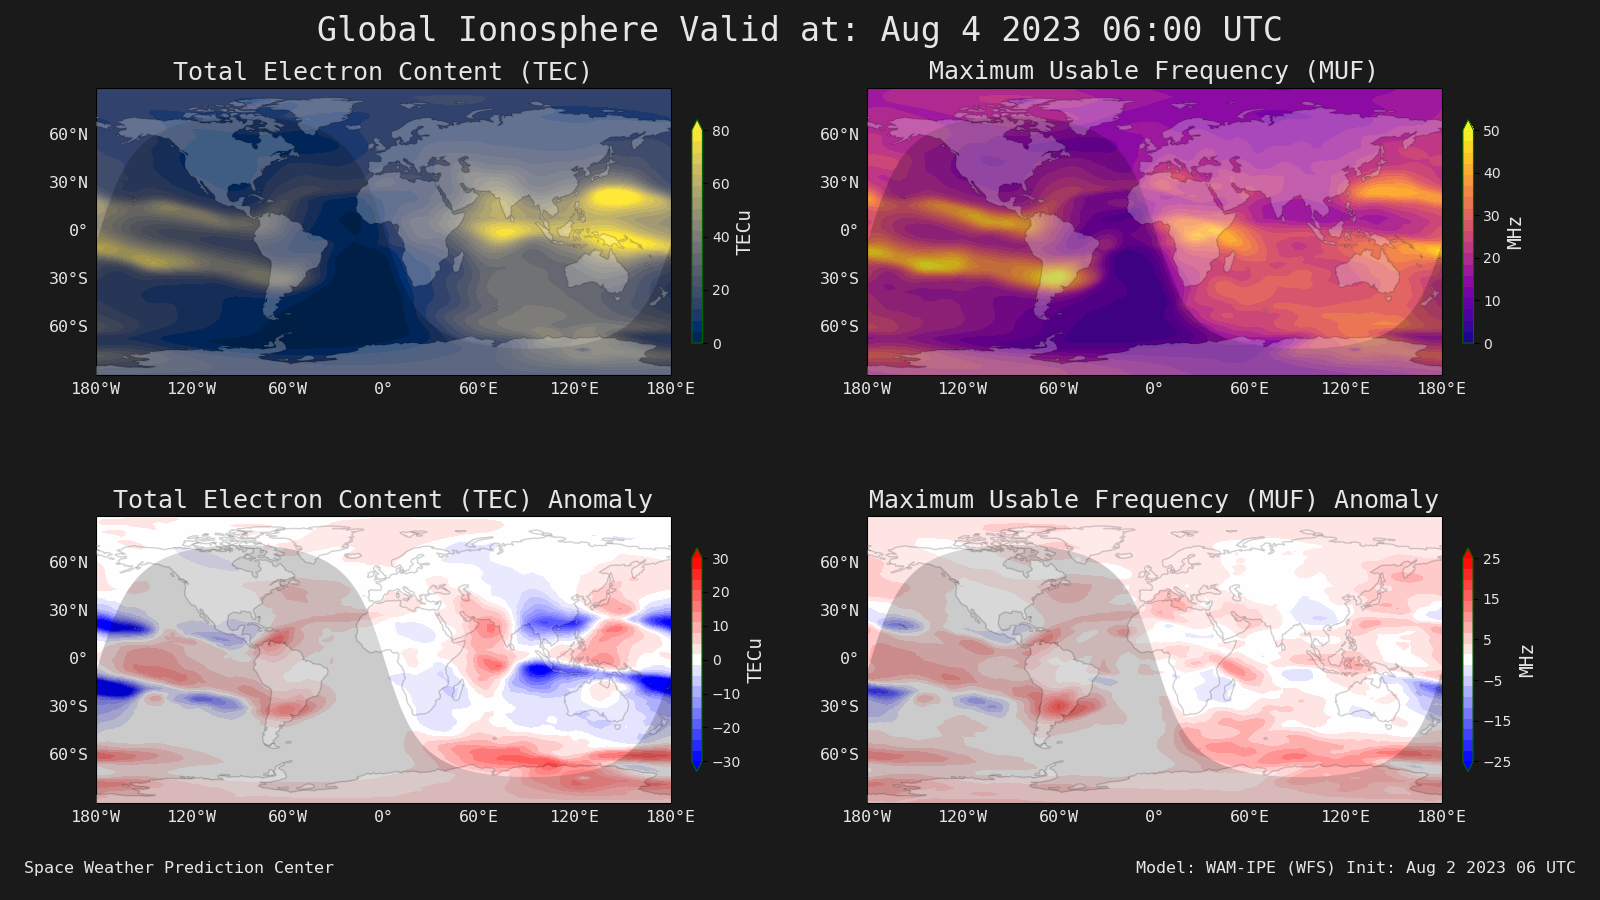
GLOBAL IONOSPHERE
The top two panels show the latest global Total Electron Content (TEC) and Maximum Usable Frequency (MUF) as forecasted by the WAM-IPE. The bottom two panels show the anomaly in TEC and MUF taking the difference between the latest values and a 10-day running average at the same universal time. The forecast is updated with the latest real-time and forecast solar and geomagnetic drivers at 0, 6, 12 & 18 UT.
Click the image below to see a 3 day animation of the prediction.
HOW DOES SPACE WEATHER AFFECT US?
Space weather can present a serious hazard to today’s modern interconnected society. This video from the Australian Bureau of Meterology explains how the sun affects communications on Earth. Did you know that solar flares impact Earth in less than 8 minutes? Particle radiation impacts between 10 minutes and several hours, and a CME (Coronal Mass Ejection) typically arrives within 12 to 72 hours. What would happen here on Earth after a large event on the Earth facing sun? This video explains the impact on our power grid, mobile phones, internet, aviation, radio communications and more.
MAXIMUM USEABLE FREQUENCY
The MUF map shows the Maximum Usable Frequency using colours and contour lines. For example, if a given area on the map is greenish and lies between the contours labelled “15” and “17”, then the MUF is around 16MHz in that location. The readings from each individual station are shown as coloured dots with numbers inside them, so you can see where the information is coming from. If a dot is faded out, then that station currently has a low “confidence score”. Source: prop.kc2g.com
A new map is generated every 15 minutes, from data that is usually between 5 and 20 minutes old. Therefore, on average, you’re looking at something based on measurements taken about half an hour ago.
MUF is the highest frequency that is expected to bounce off of the ionosphere on a path 3000km long. So the MUF along a path between two points shows the possibility of long-hop DX between those points on a given band. If the MUF is 12MHz, then 30 meters and longer will work, but 20 meters and shorter won’t. For long multi-hop paths, the worst MUF anywhere on the path is what matters. For single-hop paths shorter than 3000km, the usable frequency will be less than the MUF, because higher-angle signals “punch through” the ionosphere more easily. As you get closer to vertical, the usable frequency drops to the Critical Frequency (foF2). Source: prop.kc2g.com
Below is the current location of the moon and where it is visible on earth. Handy for EME.